| Software and Computer Systems Company, LLC |
Activity Monitor is an application provided with all
versions of Mac OS X since MacOS 10.3 (Panther) that allows a
user to view, among other things, CPU usage, memory usage, disk
activity, disk usage, and network activity. Activity Monitor
can, in many cases, be used to help isolate applications that
are consuming too many of these resources. It typically cannot,
however, help identify hardware problems. The goal of this
article is to introduce users to Activity Monitor and
illustrate the basics of using it and how to identify
performance problems with a system.
Activity Monitor is a process monitor. Every time a user
turns on their system and allows it to boot up, it is, at a
given instance, running dozens, if not hundreds, and in some
cases even thousands of processes. Some processes are started by
the system at boot time and run continually while the system is
operating. Some processes may be launched periodically,
typically at fixed intervals, to perform a specific task. Other
processes are launched by the user themselves. Activity
Monitor will sample these processes at fixed time
increments and all the user to obtain a "snapshot" of activity
each time Activity Monitor does its sampling. A
process, or application must be running in order for Activity
Monitor to detect it.
A process is, in a nutshell, a running program. All processes
are assigned a process identification number, or PID. When a
process is running it will consume CPU resources and memory, and
may additionally use disk and network resources. Most people
don't need to monitor processes unless there seems to be
something going wrong with their systems. The terms process and
application may be used to mean the same thing.
One special process, called the kernel, is the first process
started by a system and always has a process ID of 0 and a
process name of kernel_task. Once the kernel is started,
it in turn launches another process named launchd which
is responsible for launching virtually every other system
process that will be run on the system. Processes launched by launchd
may directly or indirectly run other processes as well. Once all
of these boot sequence and start up processes are running, your
system is ready to be used. Most people are unaware of any of
these processes unless they use a tool like Activity Monitor
to obtain information about them.
When you double click on an application icon to launch it, you
are indirectly starting at least one process. The icon that you
double click on to start the typical application is not really
an application, it's a special folder that contains not only the
code to launch one or more processes, but also resources that
the processes may use, such as icons, help files, fonts, etc. An
application process may itself run other processes if needed.
Processes running on a system may or may not have names that
appear to make sense to the user. For example, when you launch Safari,
its process name will likewise be named Safari. Newer
versions of Safari will also launch another
process named
Safari Web Content. Other processes have more obscure
names, such as mds (the meta data server used by
Spotlight) or usbmuxd (the process that handles USB
activity.)

The most common reason Activity Monitor is used is to try to determine why a system that was once functioning properly has become exceptionally slow. Performance losses are typically due to excessive CPU use by a process and its siblings, excessive memory consumption, excessive disk activity, or excessive network activity. In many cases, particularly on laptop computers, if the system starts overheating and the cooling fans are turning on too frequently, it's likely that the CPU is being overloaded. Hardware problems, such as a failing hard drive may also produce similar symptoms, and this will be dealt with a little later.
Activity Monitor is located in the Utilities folder contained in the Applications folder. Newer versions of OS X will have give direct access to the Utilities folder by clicking on the "Go" menu bar item in Finder and then clicking "Utilities" which will open up the Utilities folder directly. Older versions of OS X will require that you open up Applications first, and then open up the Utilities folder. Once the Utilities folder is open, simply double click on the Activity Monitor application icon, and it should start.
Once Activity Monitor has been started, the user interface should appear and be similar in appearance the the screen shot below.
We've observed that some versions of Activity Monitor will
require the user to click on the "Window" option of the Activity
Monitor menu bar to bring the user interface up.
To best appreciate this tutorial, open up
Activity Monitor now and follow along.
The top section of Activity Monitor allows you to quit a
selected process, inspect a process, sample a process, and
select which processes to observe. The middle and main section
of the interface reports on the activity going on in the system.
The bottom of the interface allows you monitor CPU usage, memory
consumption, disk activity, disk usage, and network
activity. We will describe these in detail from the top to
the bottom of the user interface.
Going from left to right in the top section of the user
interface, you'll see four buttons labeled Quit Process,
Inspect Process, Sample Process, all bundled in the left
section of the interface, and a process selection button on the
right half of the user interface. The process selection button
typically says "My Processes" on it the first time Activity
Monitor is invoked by a user. All the buttons on the left
will only become active when a process is selected from the list
of processes displayed in the mid section of the user interface.
The Quit Process button will allow you to
terminate a process. Any of the processes in the mid section
displaying the list of running processes can be highlighted by
clicking on them, and after doing so the normally grayed out Quit
Process button will become active. If you click on it, a
dialog will appear asking if you wish to Quit the
process, Force Quit the process, or Cancel the
operation. This is a potentially dangerous button because it
can terminate system processes which may render the system
dysfunctional, or in some cases even shut it down. Quitting a
process should only be done on processes that are not system
processes.
The Inspect button allows you to open up a dialog
window with more details on the process. This button will be of
more use to developers than the average user, and generally
shouldn't be needed.
The Sample Process button will sample the
selected process and show the amount of time the process spends
in various methods and libraries. It's typically only of use to
developers.
The process selection button on the right hand of the top
portion of the user interface will allow you to select which
processes are being displayed. Its label will typically read one
of the following:
All Processes: If this is selected, the
every process that's running on the system is being displayed.
This is typically what most users will want use.
All Processes, Hierarchically: All processes are
displayed with respect to the processes that launched them. If
you select this option, you will notice that the kernel_task
stands by itself, with launchd, the launch daemon,
parenting virtually everything other process running on the
system. For most people, this won't be of much value unless a
running application has launched another process that's become
problematic. In this case, viewing the hierarchy can indicate
whether or not the offending process was launched directly or by
another process or application.
My Processes: This will display all processes that
have been launched either directly by you, or on your behalf by
the operating system.
System Processes: This option will
display all processes started by the operating system.
Generally, none of these should be terminated using the Quit
Process option previously described because they it may
render the system or some system features dysfunctional, and
possibly crash the system.
Other User Processes: Some of the processes
started by the system are done using a system ID unique to that
process. Any process launched using such an ID will use that ID
and fall into this category. This is generally only of use to
developers and system administrators.
Active Processes: This option will list all the
active processes each time Activity Monitor samples
activity. The operating system, as well as applications, may
start and stop a number of processes for a host of minor tasks.
Additionally, during a process sampling, some applications may
go from an active to an inactive state. For these reasons, the
list will expand and contract frequently. This option won't be
of much use to us for this article, but it's interesting to
watch for a few minutes to get a feel for how the operating
system is constantly launching and terminating processes, and
some applications go from an inactive to active state with the
user is unaware of it.
Inactive Processes: This option is the exact
opposite of Active Processes in that it shows those that
currently aren't active at the time of sampling. This list of
processes will also expand and contract. This won't be of much
use to us for this article.
Windowed Processes: This will list all the
applications that are active on the desktop, including Finder.
This can be of some use if problems are associated with a
specific application that runs on the desktop because it can cut
down on some of the clutter presented by other processes.
However, many windowed (or desktop) applications can also launch
other processes that may not show up in this list.
Selected Processes: You can select a number of
processes from the process table by command-clicking on each one
that you want to monitor and then selecting this option. Activity
Monitor will display activity for only the selected
processes. This option is extremely useful, especially if you
want to see if you can duplicate the behavior of a poorly
behaving application. For example, if you thought Safari
was eating up too much memory, you could command-click on Safari,
Safari Web Content, and other applications Safari
may launch, such as Flash Player and then select this
option, and it will display only the activity associated with
these applications. However, if any of the selected processes
launch other processes, they won't show up in the list, so this
option should only be selected if you want to observe specific
processes and aren't concerned with anything else they may
launch.
The following two screen captures of Activity Monitor illustrate the process of highlighting and then selected processes associated with Safari.
In the screen shot above the processes currently associated with
Safari while watching a YouTube video have
been selected. This was done by viewing all the processes with Safari
active, clicking on the %CPU column, to order them by the amount
of activity, and then command-clicking on each one to select
them.
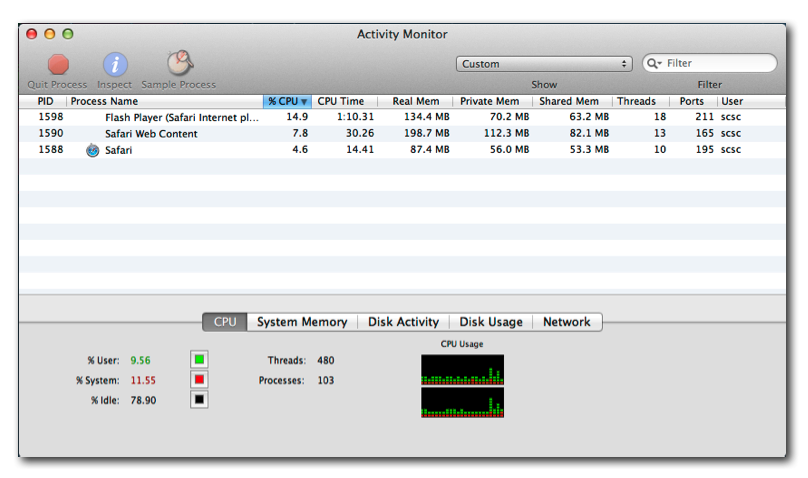
Once the processes are selected, in the upper right corner,
change the process list from All Processes to Selected
Processes. After doing so, the Activity Monitor
changes to display only the targeted processes, and the process
list now says Custom.
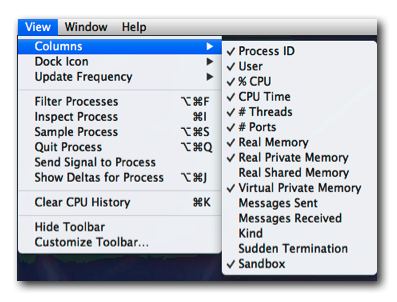
The mid section of the user interface, which occupies the
majority of the application, is the list of processes being
monitored. This is fully configurable from the Activity
Monitor menu bar by selecting the View option
followed by
Columns. The screen shot below shows this menu item
selected.
The columns that you choose to display can be moved around in
the user interface in any order you want to present them by
clicking on the column head and dragging it into the location
you desire. The width of the columns can also be adjusted.
For the purposes of this article we'll use the following:
PID: The process ID number
%CPU: This indicates the percentage of CPU usage
used for each process during Activity Monitor's sampling
snapshot.
CPU Time: This is the total amount of CPU time the
process has used since being launched, This is not the amount of
time the application has been running.
Real Mem: This is the amount of real memory the
process is actually using, and it often changes between Activity
Monitor samplings.
Private Mem: This is memory private to the
process.
Shared Mem: This is memory shared by the
application and other threads or processes running on the
system.
Threads: A thread is called "lightweight process"
in that it acts like another process launched by the
application, but still shares resources with the application
that started it. Threads can terminate on their own or be
terminated by the process that started them.
Ports: This is the number of ports the process is
using. Ports can be associated with network connections,
devices, and files, to name a few.
User: This is the short (Unix) name of the user
that's associated with launching the process.
The order of the processes may be rearranged by parameter by
clicking on one of the column headers. For example, if you want
to view the processes in alphabetical order, click on the column
header Process Name. To arrange the processes in order
of real memory consumption, click on the header Real Mem.
To determine which processes are currently using the CPU the
most, click on the header %CPU. The order may be
reversed by clicking on the column a second time. Remember to
adjust the scroll bars on the side of Activity Monitor
to position the list of processes at the top. As you'll see
later on, this feature can help us find problematic
applications.
Along the bottom of the user interface is a tabbed selector with
the titles CPU, System Memory, Disk Activity, Disk Usage, and
Network. Each of these presents data in a graphical
manner, instead of being tied to a specific process or
processes, it's reporting on the system as a whole. Details
regarding each option are as follows:
CPU: The dynamic graph shows the amount of
CPU resources being dedicated to user and system processes, as
well the the idle state, which is an indication of how busy the
CPU is. During levels of intense CPU activity, these figures
will often peg up to the top of the graph. There will be one
graph for each processor core. Most systems currently have 2
processor cores, so they'll have 2 graphs.
System Memory: This is probably the most important
graph that you'll need if you're system is having memory
problems of some type. The Free memory is just what it says it
is: memory that's not in use and is available to be used. The Wired
memory is the memory that's in use and can't be swapped out
because it's critical to the operation of the system. The Active
memory is memory that's in use, but can be swapped out because
the process associated with it is not critical to the operation
of the operating system. The Inactive memory is RAM that
was in use by a now terminated process, but the operating system
is hanging onto it to speed up the re-launch of the application
if it's started again. Inactive memory is essentially
free memory and can be reclaimed if the operating system or
other applications need it. To the right of these are the VM
size, which can generally be ignored, the Page ins,
which can also often be ignored, the Page outs, which is
an indication of pages being read from disk and restored to RAM,
and the Swap used.
Disk Activity: Disk activity displays how much the
drive is being accessed for reading and writing. Excessive disk
activity can indicate that the system is low on memory and is
swapping memory contents from RAM to disk, and back again, as
needed to keep applications running. High activity is also
associated with disk intensive applications, such as Spotlight
indexing. Notice that the "peak" indicator at the top of this
graph may change with activity, so at times it might be somewhat
tricky to interpret.
Disk Usage: This illustrates how much of your
bootable volume is used.
Network: This illustrated the amount of network activity
going on in the system. Like the Disk Activity graph,
the indicated peak on the top of the graph can change with load,
so it can be tricky to monitor.
From a user standpoint, performance problems will exhibit one or
more of the following symptoms:
Slow Loading Times: Slow loading times occur when
an application that used to load within a certain time frame,
such as a few seconds or less, is now taking much longer to load
- tens of seconds or perhaps even minutes.
Slow Response Times: Slow response times occur
when an application that used to respond to user input in a
fairly timely manner is now taking much longer to respond.
Application Lockup: Application lockup indicates
that the application appears, for all purposes to have locked up
completely and is no longer responding to any input. In some
cases, if you click on the apple icon in the far left of the
Finder menu bar and select the Force Quit…
option, the dialog that comes up may or may not indicate that
the application in question is no longer responding. In the
event the application may be waiting for input from another
source, such as a file on a hard drive that no longer exists
or a network connection that has closed, the Force Quit…
dialog will likely indicate that the process is still active.
Application Crashes: Application crashes can occur
when they start or during execution. If an application is
started and it soon exits, often for no apparent reason, the
operating system will often, but not always, report that the
application crashed. In other cases, the crash may resemble that
described above as an application lockup, but in this case the Force
Quit… option should be able to identify the application as
no longer running.
If any of these problems are consistent across all applications,
meaning all applications are having the same symptoms all the
time, then the problem is likely a system resource problem
(insufficient RAM or too little space left on the drive), a lack
of computing power, or possibly a hardware problem. If the
problems seem to exist erratically or only when certain other
applications are running, it's likely that there is one or more
application that's consuming too many system resources or
demanding too much from the system. Remember that the system can
launch processes without your being aware of it.
Performance problems can be caused by hardware problems (such as
a problematic hard drive,) insufficient resources such as a lack
of memory or free disk space, excessive load on the system, or a
CPU that can't really handle the load. Activity Monitor
typically can't help identify hardware problems, and these will
be addressed at the end of this article. We will focus primarily
on problems that Activity Monitor can help you identify.
Operating System Upgrade: Unfortunately, when a
new version of an operating system is released, it's often being
targeted at current hardware, not older hardware. The reality
may simply be that the system you own, even though it may be
identified as being "supported" may in fact not have the CPU
power to run the newer version of the OS efficiently, or with
the response times that you might have been used to on previous
operating system releases. If Activity Monitor is
showing no signs of problems, such as too much memory
consumption, excessive swapping, or too much disk activity, the
reality may be that the your system isn't really capable of
operating at the performance levels you might have been used to
with previous operating system versions. It is not uncommon for
a new operating system release to require the use of more memory
to run effectively.
Insufficient Memory: If there's insufficient
memory in the system, Activity Monitor will display it
with page-outs and swap file sizes being greater that 0 when the
system is put under only a moderate load. Although Mountain Lion
states that it can run on 2GB of RAM, it doesn't necessarily
claim it will run well with 2GB of RAM.
Tests at the SCSC lab on a MacBook with 2GB, and then
4GB of RAM made this point clear. With 2GB of RAM, if several,
typical applications were launched simultaneously, such as
Safari, iTunes, Mail, and App Store, after using
the system for about 30 minutes, the page-outs went from 0 to
roughly 400MB, and the swap file size went from 0 to 2GB. When
the memory was increased to 4GB and the same experiment was
performed, the page-outs and swap file size remained at 0.
Paging out and swapping occur when memory runs short in the
system. To compensate for the shortage of memory, the system
writes inactive processes to the drive, and when they're needed
again, it reads them from the drive and loads them back into
memory, often swapping out some other process at the same time.
This process is time consuming and will bog the system down.
A quick overview of the memory being used by the system can be
found in the lower section of the Activity Monitor user
interface by clicking on the System Memory button. If
there is very little free memory available in the memory pie
chart, and the Page outs and Swap used fields
are greater than zero, memory problems should be considered a
viable performance problem suspect.
Insufficient Free Hard Drive Space: This is a
problem that most people are unaware of. If the free space on
their hard drive is insufficient, it will radically cut down on
the performance of the system, and can eventually make it
unstable. The operating system is constantly writing data files
to the drive without your knowledge. For example, when you put
the unit to sleep, the OS writes the entire contents of RAM to a
file named "sleepimage" (for those of you familiar with Unix
file operations, it's located in the
/private/var/vm/sleepimage file) and it is always the size
of your memory, thus if you have 4GB of RAM, this file will be
4GB in size. Additionally, other files, such as swap files, and
Time Machine "snapshot" files can eat easily eat up
gigabytes of data as well. During an operating system update,
there needs to be free space available to download the update
files, which can often be over a gigabyte in size.
At SCSC, for normally configured systems, the bare minimum
allowed free drive space is calculated using the following
formula:
2 X [System Memory Size] + 0.05 X [Volume Size]
For example, using the MacBook described in the experiment above
with a system memory of 4GB and a volume size of 80GB, this is:
2 X [4GB] + 0.05 X 80GB = 12GB
Note that this is the bare minimum drive space that should be
allowed for a volume and it's not set in concrete. The more free
space you have available on a drive, the better the performance
will be.
A quick overview of the amount of free space on the currently
active volume can be obtained using Activity Monitor by
clicking on the Disk Usage button in the lower section
of the user interface.
Excessive Drive Activity: Excessive drive activity
can be a side effect of a system with too little RAM, too little
free disk space, or it might be a process that's extremely drive
intensive. If there is too little memory in the system, the
excessive disk activity is caused by swapping memory contents to
the drive and back into memory because of the shortage of
memory. In the event a system has too little free space left on
the volume, the system must go through a process of hunting for
free blocks on the drive while simultaneously deleting any
temporary files it can in the process. In the event a disk
intensive application is running, which may be a system process
or a user added application, such as a database, the activity
will vary along with the activity of the offending process.
A quick overview of disk activity can be obtained by clicking on
the Disk Activity button in the lower portion of the Activity
Monitor user interface. This will display a sampled graph
of both data read and written between the drive and the system.
Excessive CPU Activity: Excessive CPU activity
typically occurs when one or more processes are demanding so
much from the CPUs that they interfere with other processes that
need CPU access as well. Another factor, that Activity
Monitor doesn't provide is called the priority of a
process. Processes with a higher priority, such as mds
in Mountain Lion, are given a very high priority and can thus
effectively hog CPU cycles away from other running processes.
CPU activity may be viewed for each CPU core on a system by
clicking on the CPU button in the lower section of Activity
Monitor. There will be a small, graphical window for each
active CPU core in the system. When the CPU activity is
excessive, each window can be virtually filled with user and
system activity. Each CPU core can contribute up to 100%
processing power, thus the number of CPU cores determines the
total percentage of power. A system with 2 CPU cores can thus
equal 200%, or 100% per core.
Excessive Network Activity: Excessive network
activity can be misleading, because in some cases, particularly
during web browsing, it may vary radically based on the web site
being visited as well as how much traffic is on the network.
Examples of other applications or activities that may cause
system slow downs based on high network activity can be
networked backup applications, database client applications, and
file downloading operations, to name a few.
Network activity may be monitored using Activity Monitor
by clicking on the Network button found in the lower
section of the user interface.
Too Many Applications Running: Unfortunately,
computers can't handle an infinite number of running processes.
The user needs to be aware of how much of a load an application
is putting on the system if performance problems start to exist.
The more memory and free disk space available, the more
applications you'll be able to run with fewer problems.
Insufficient CPU Power: Insufficient
CPU power can occur if the applications or system processes are
putting such an extreme load on the system that the CPUs are
constantly running at very high usage levels.
CPU activity may be monitored using Activity Monitor by
clicking on the CPU button found in the lower section of
the user interface.
Bugs: Software bugs can exist in both processes
acquired from a third party, and those coming with the operating
system itself. Bugs can often be difficult to trace or obvious.
In many cases bugs will become obvious because the application
will crash. In other cases, they may become "resource hogs" and
start consuming abnormally high amounts of RAM, start using
abnormal amounts of drive space, or make excessive use of the
CPU.
Hardware Problems: Hardware problems, such as a
hard drive with bad sectors on it can cause serious performance
problems. Such problems typically can't be addressed using Activity
Monitor and will be dealt with at the end of this
article.
Now that you're somewhat familiar with Activity Monitor,
we'll go ahead and use it to monitor a process. In this case,
we'll use a process that's frequently problematic, mds.
On Mountain Lion, if Spotlight is in full indexing mode,
it can cause the system to slow to a crawl, or even appear to
lock up a unit. For example, if we take the MacBook used
in the previous example and open a TextEdit.app session,
it normally starts in less than a second. With Spotlight
running in full indexing mode, we've seen TextEdit.app
take up to 20 seconds to start. The tell tale sign of Spotlight
indexing can be found by clicking on the Spotlight icon
(magnifying glass) in the upper right hand corner of the
display.
The mds process frequently launches other processes that
are either named, or start with the name mdworker. To
find these, do the following:
1. Click on the column named Process Name.
2. Scroll down to find mds.
3. Command click on the mds process and all others
beginning with or named mdworker.
4. Monitor these both when Spotlight indexing is
occurring and when it isn't.
The most important columns you need to pay attention to are
those labeled %CPU and Real Mem, and
secondarily CPU Time, Private Mem, Shared Mem, and
Threads. When Spotlight is in full indexing mode,
CPU use will skyrocket, disk activity will go very high, and the
amount of memory in mds will go from tens of megabytes
to hundreds of megabytes.
The following two images illustrate Spotlight in
its initial and full stages of indexing:
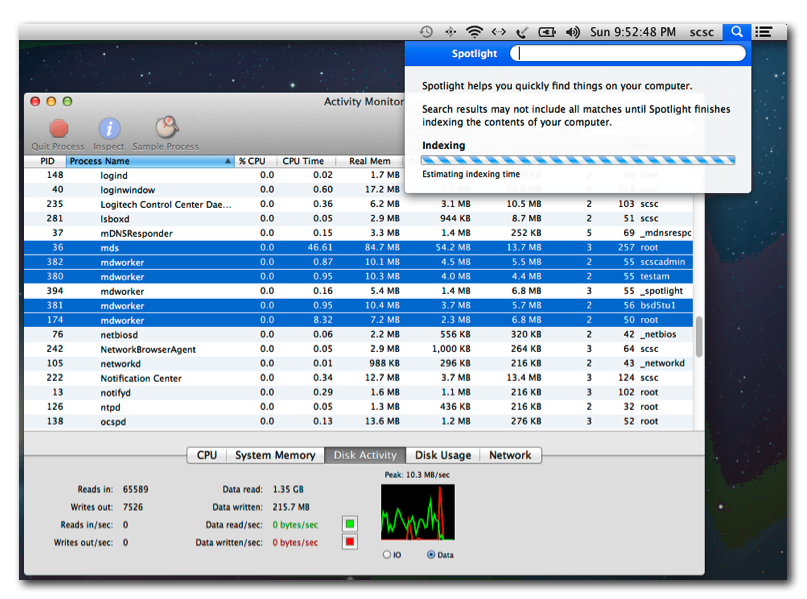
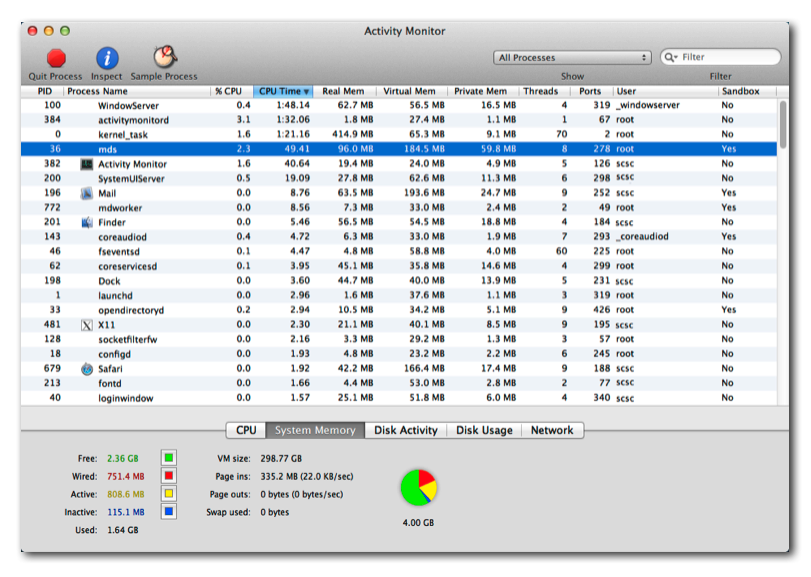
In the image above, Spotlight is in its initial indexing
phase. We've highlighted most of the mdworker threads,
but another popped up in the middle of the group as the screen
shot was taken. Notice at this time, the %CPU column
shows 0.0 for mds and mdworker elements, but
that the disk activity shown at the bottom of the display is
relatively high.
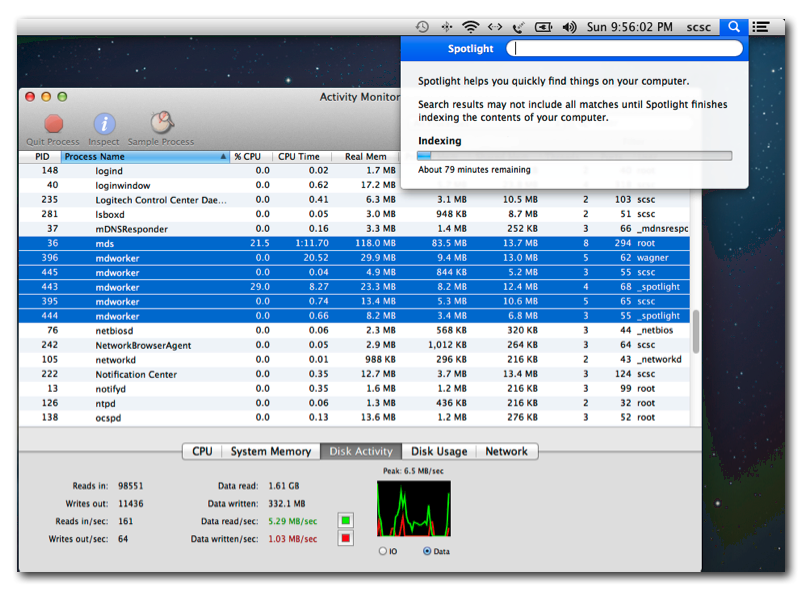
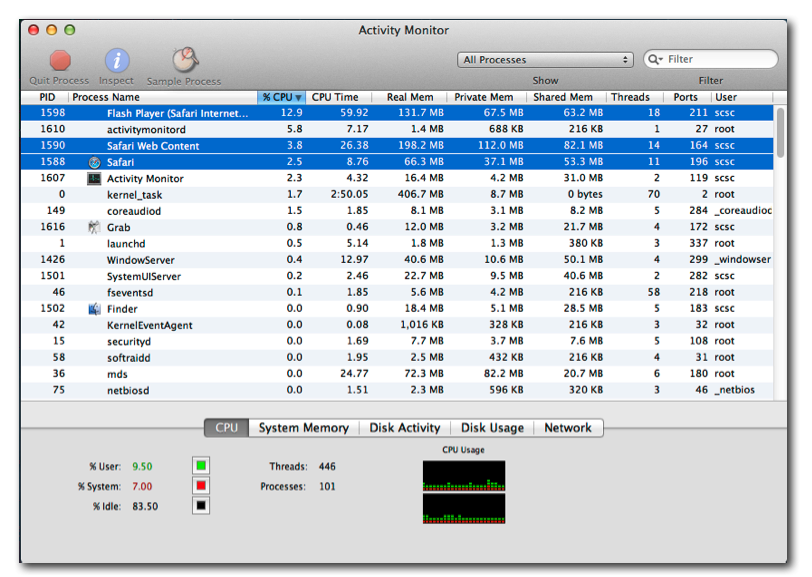
In the screen shot above, mds is now in full indexing mode. Notice that the drive activity is still high, but now the CPU consumption is increasing as well. When this occurs, many applications will come to a complete crawl. On laptops, the fans will kick on, and the battery consumption will increase.
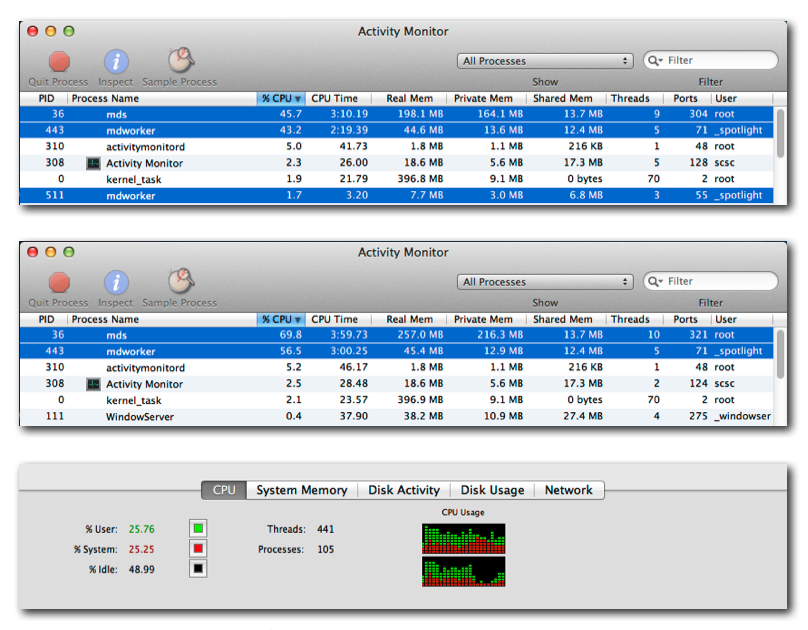
In the three partial screen shots of Activity
Monitor above we can observe how intensive mds is
when Spotlight indexing is occurring. In the first two,
we've selected the %CPU column, which illustrates the
highest CPU consumption going on in the system. Notice that in
the first shot, we see three mds related processes, and in the
second we see two. Notice also that in the second, the
percentage of the consumption for mds and mdworker
is a total of 126.3%. Remember, this system has two cores, thus
the total percentage can reach 200%. Over 60% of the total
processing power (126.3/200) is being spent doing
Spotlight indexing. The number of mdworker
threads can vary from zero to many at any given instance during
Spotlight indexing.
In the third screen capture, we see the CPU processing
that's going on in the CPU Usage graph. Although not pegged,
it's quite high.
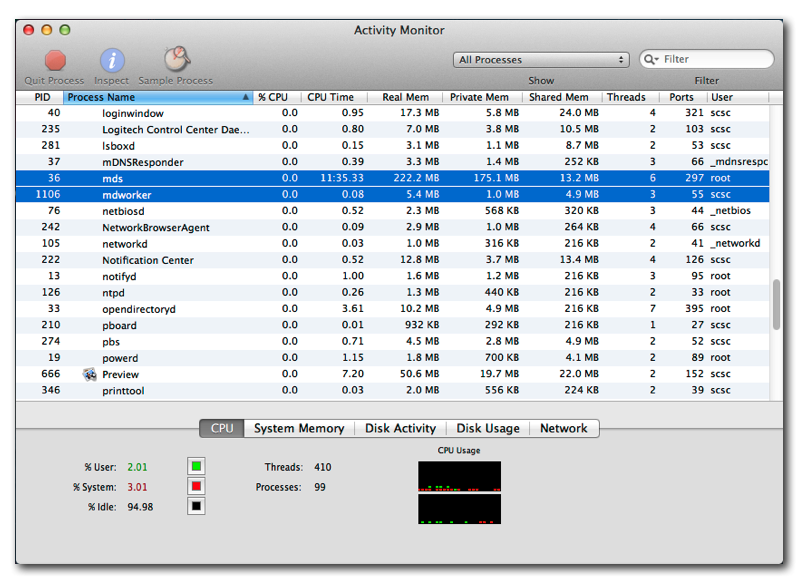
In the screen capture of Activity Monitor above,
Spotlight indexing is complete. Looking at the
highlighted items, which were located by clicking on the Process
Name column header, the CPU consumption has fallen to 0%,
and there is only one mdworker thread "hanging around," but the
real memory being held onto by mds is not over 222MB. Notice
also that the CPU Usage graph in the bottom section of
the user interface is showing very little CPU activity. Over
time, it's not uncommon for the amount of real memory in mds
to reduce considerably when
Spotlight isn't in a full indexing mode.
In our opinion, when using Activity Monitor to identify
a performance problem, the most important items will be those
shown in the %CPU and Real Mem columns.
Additionally, the graphs located at the bottom of the Activity
Monitor user interface, particularly CPU, System
Memory, and Disk Activity
graphs should give a good indication of how heavily loaded
the system is. The information in the Private Mem,
Shared Mem, Threads, and Ports, may be of use to
you if you're looking at an "application gone wild." Get a feel
for how much processes use by clicking on each one of these
column headers in Activity Monitor to see what processes
typically use.
The CPU Time column can be simultaneously useful and
misleading because it tracks the total amount of time that the
CPU has dedicated to a process since started. If you terminate
an application, and then restart it, then the column entry will
only indicate the amount of CPU time spent on the most recent
launch of the application. Processes such as kernel_task
that are running all the time will almost always be at or near
the top of the list if this column is selected. If you launch an
application, its CPU TIme entry will always initially be
0. If, in a matter of minutes it's accelerated its way to the
top of the list, then it indicates that the CPU is spending an
incredible amount of time hogging CPU resources. The mds
process will do this when it's in full indexing mode.
The best way to learn to use Activity Monitor is to
simply use it and get used to how it monitors processes. If
you're not inclined to wait for a Spotlight indexing
session to begin, another route would be to bring up Safari
and start watching a high def video on something like YouTube.
In this case, you would want to focus on Safari, Safari Web
Content, and the Flash Player.
Some of the common problems we've observed are described below.
In some cases, these aren't operating system, process, or even
system problems. Some of the problems we've seen people
encounter are caused by external problems or even user error or
unawareness. Here is a list of some of the more common problems
we've encountered:
Web sites and ad servers: Many websites
that display ads, especially lots of ads, are feeding a web
browser not only information from their own web site, but also
piping in web data from ad servers. Ad servers may be located
anywhere in the world, and in most cases they're not hosted on
the web site being visited. If network traffic to one or more ad
servers is heavy, the overall response of the browser may be
slow. If the page being visited won't complete loading until the
ad server completes its loading, this can mislead the user into
thinking that the browser or the system are at fault, when in
fact it's the site being visited.
This problem will obviously only occur when web sites are being
visited. In some cases, the ads themselves may be playing video
and launching a Flash Player, and these things take CPU,
memory, and network resources. The most obvious cure for this
problem is to, if possible, go to another web site that has the
same information but fewer ads. If evaluating it using
Activity Monitor, you would want to monitor the Safari
and Safari Web Content processes, and possibly the Flash
Player (or another media player if applicable) for
resource consumption. You would also want to monitor the Network
graph in the lower section of Activity Monitor's user
interface to see if the network is being tied up or saturated.
Pay attention to the "peak" level on top of the network graph,
because it will change with loading.
Unawareness of relaunched applications: With the release
of both Lion and Mountain Lion, one problem that we've observed
is that some people are unaware of the fact that when they shut
their system down, unless told not to do so, the operating
system will open up and start all the applications they had
running in the previous session. If they're using multiple work
spaces and the applications are assigned to specific work
spaces, the user is oblivious to the fact that they may
inadvertently and unknowingly launching numerous applications.
They find the start up times and login process abysmally slow.
They then start opening up other applications which simply
exacerbates the problem.
Activity Monitor will make this clear, but it shouldn't
really be needed, since switching from desktop to desktop
usually makes the user aware of the problem. Activity
Monitor output might be useful, however, if one of the
applications is problematic or the problem is being dealt with
from a remote location.
Spotlight and mds: This was described in the
previous section. If applications suddenly come to a crawl,
they're taking seconds or tens of seconds to open or react to
input, there's a good chance Spotlight indexing is
taking place. As described previously, this can be detected
using Activity Monitor.
Safari Web Content (Mountain Lion): Safari Web
Content appears to have some strange bugs that seize a
considerable amount of memory for no apparent reason. In one
instance, we've observed it eating up nearly 100% of the free
memory on a system forcing the system to a crawl. This bug is
difficult to replicate. If we could replicate it we'd send a
report to Apple, but it seems to occur erratically and not
frequently, but we've seen it reported on other systems as well.
In this case, application loading and response times will be
slow. Activity Monitor will present this to the user
with an extremely high amount of memory being consumed by the
process as seen in the Real Mem column of the process
table. The System Memory graph in the lower section of Activity
Monitor will display little, if any free memory. The
solution is to terminate Safari and if needed, use the
purge command to reclaim memory (using purge is described
later.)
Flash Player Safari Plugin: Depending on the video
being viewed within Safari, this process can consume
considerable amounts of memory and show high levels of network
traffic, disk activity, and CPU cycles. This is more or less
dependent on the video being viewed because low bandwidth video
won't consume very many resources, but high def video will. This
will can be a potential problem if you have a lot of other
applications running and a system with weaker processing
capabilities, less than optimal RAM, or a lack of free disk
space.
When you click on the System Memory button of Activity
Monitor, you'll be presented with a pie chart showing the
amount of memory in the system, and how it's allocated. It will
look similar to the following:
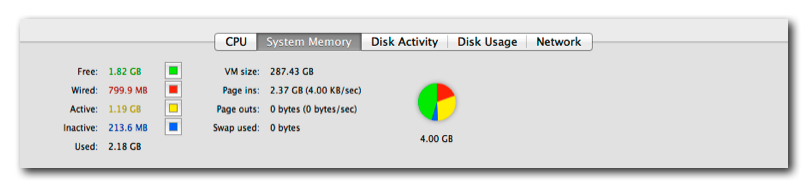
Some people become alarmed, when instead of seeing a graph as
shown above, with a reasonable amount of free memory available,
they're greeted with the following:
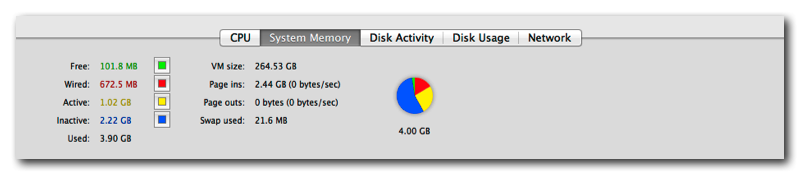
People become (unnecessarily) alarmed by this because it appears
there's virtually no free memory on the system. This isn't true,
it's just a characteristic of the operating system. The memory
above shown in blue, which is called Inactive Memory is
free memory. When a process launches, gets used, and then ends,
the original memory is not automatically put back into the free
memory, but often the Inactive Memory. The system does
this so that if the application is launched again, instead of
having to reload everything all over again, it simply uses what
was there from the original launch of the process. If other
processes are launched by the system and they need that memory,
the system will turn it over to them.
If you find this troublesome, there's a system command named
"purge" that will completely free up all the "blue memory" shown
above. purge must be run from a command line (Terminal) window,
which can be accomplished as follows:
1. From the Finder
menu bar, click on "Go"
2. From the pull down
menu, select Utilities.
3. From the Utilities
folder that comes up, double click on Terminal.app
4. A terminal
application will open up.
5. Type the word
purge and hit the return key.
If you have an Activity Monitor session up and running
you will see that the "blue memory" disappears and becomes free
memory.
If you've analyzed your system using Activity Monitor
and can find no problems with the operating system or any
running applications, there may be hardware problems with the
unit. If the problems are characterized by delays, "spinning
beach balls," and occasionally a message from the operating
system indicating that it can't read or write to the drive, the
odds are that the hard drive has problems. In some cases, system
parameters can become corrupt over time and cause the system to
behave erratically.
Here at SCSC, we offer a product named Scannerz for Mac OS X
that performs hard drive and system fault tests on Apple
computers. If you suspect you're having drive or drive related
system problem, click HERE
for information on Scannerz.
If you think your system might need to be reset, the following
links to Apple's support site might be of use to you:
Resetting
NVRAM and PRAM
Resetting the
System Management Controller
Generally speaking, there are very few items on a contemporary
system that can fail without being obvious to the end user. If a
logic board fails, the system won't start, or if it does, it
won't stay active long. If a video, network, keyboard, or other
attached peripheral or card fails, that too is usually obvious.
If drive tests and system resets can't isolate the problem, we
would recommend having the unit checked out by a professional.

Scannerz, Scannerz Lite, FSE, FSE-Lite, Performance Probe 2,
Phoenix, SpotOff, and Spot-O-Meter are Mac OS X universal
binaries and support both Intel and PowerPC G4 and G5 based
systems using Mac OS X versions 10.5 (Leopard), 10.6 (Snow
Leopard), 10.7 (Lion), 10.8 (Mountain Lion), 10.9 (Mavericks),
and 10.10 (Yosemite). PowerPC based systems must use Mac OS X
10.5
Supported Intel based systems include all variants of the
MacBook, MacBook Air, MacBook Pro, iMac, Mac Pro, and Mac Mini.
Supported PowerPC based systems must be running MacOS 10.5
(Leopard) and include the iBook, Power Mac, eMac,
iMac, Mac Mini, and PowerBook G4 Series.
All Software and Computer Systems Company, LLC logos are a
trademark (TM) of Software and Computer Systems Company, LLC.
Scannerz, Scannerz Lite, Scannerz with FSE-Lite, Scannerz with
FSE, FSE, Phoenix for Mac OS X, Performance Probe for Mac OS X,
SpotOff, and Spot-O-Meter are trademarks (TM) of Software and
Computer Systems Company, LLC. All software produced and
licensed by Software and Computer Systems Company, LLC is
copyright© Software and Computer Systems Company, LLC 2005 -
2018. The contents of all pages and images contained in this web
site are copyright© Software and Computer Systems Company, LLC,
2005-2018.
Apple is a trademark of Apple Inc., registered in the U.S. and
other countries. Apple Macintosh, Mac, the Mac Logo, and
MacOS are registered trademarks of Apple Inc, in the U.S. and
other countries. PowerPC™ is a trademark of International
Business Machines Corporation. Intel is a trademark of Intel
Corp. in the U.S. and other countries.
